Ely Khatib GIS Portfolio

Ely Khatib GIS PortfolioEly Khatib GIS PortfolioEly Khatib GIS Portfolio

Ely Khatib GIS Portfolio

Ely Khatib GIS PortfolioEly Khatib GIS PortfolioEly Khatib GIS Portfolio
  • Home
  • GIS Coursework
  • Professional Documents
  • More
    • Home
    • GIS Coursework
    • Professional Documents
  • Home
  • GIS Coursework
  • Professional Documents

demographic visualization

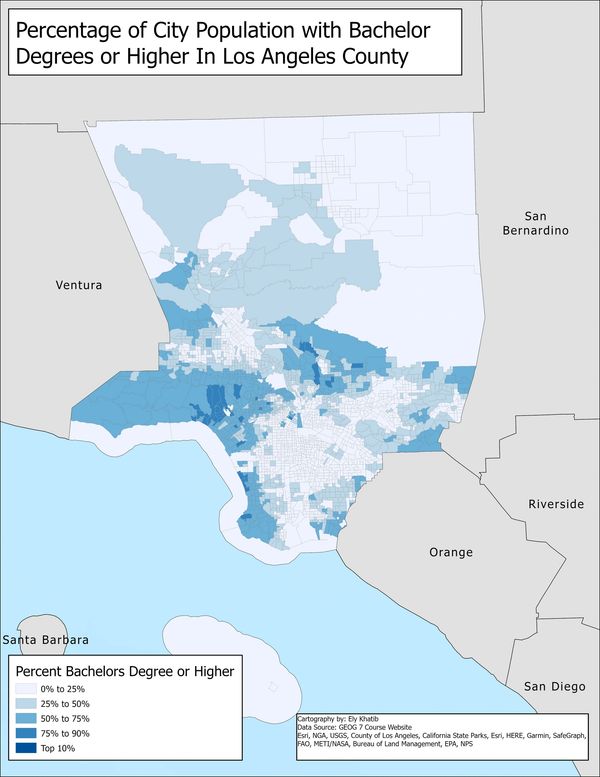
Choropleth Image of Percentages

The choropleth map is an example of how demographic data of a county can be aesthetically displayed. It conveys the percentage of people with a bachelors degree or higher in each sector of LA county, where darker colors indicate a higher percentage.

Urbanization Imagery

The map of Belgium illustrates urbanization of the country and surrounding areas, along with significant cities and rivers.

GIS Portfolio

Copyright © 2024 Ely Khatib GIS Portfolio - All Rights Reserved.

Powered by GoDaddy

This website uses cookies.

We use cookies to analyze website traffic and optimize your website experience. By accepting our use of cookies, your data will be aggregated with all other user data.

Accept