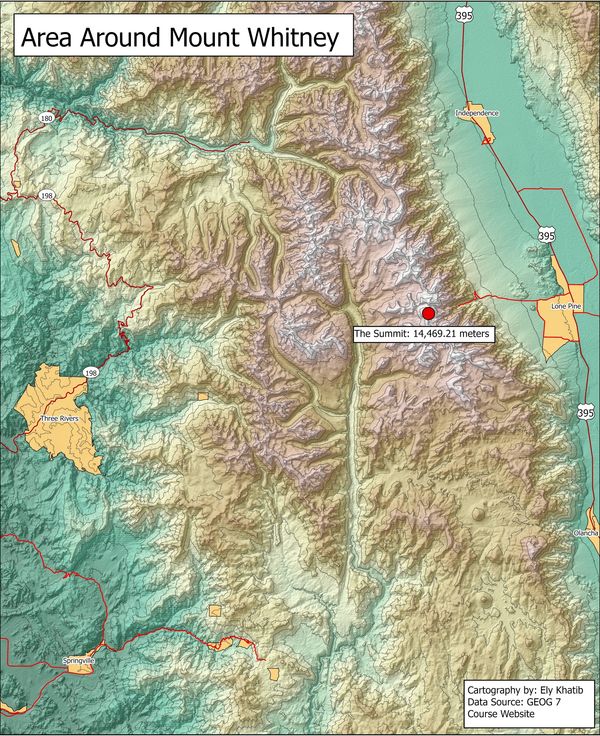
Mountain Ranges
A hillshaded relief map of the mountain ranges around Mount Whitney is displayed to the left. This image is accompanied by the major roads, a label of the summit and its elevation, and surrounding villages.
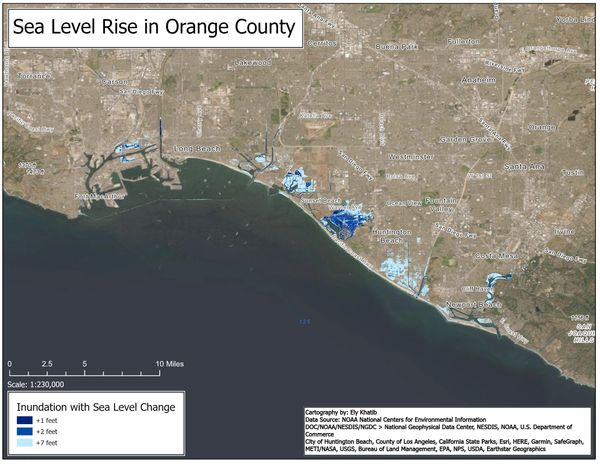
Sea Level Rise
Here one can see the affects of various sea level inundations on the coastal cities of Orange County. The lighter the color, the higher the sea level rise and therefore the greater the impact.
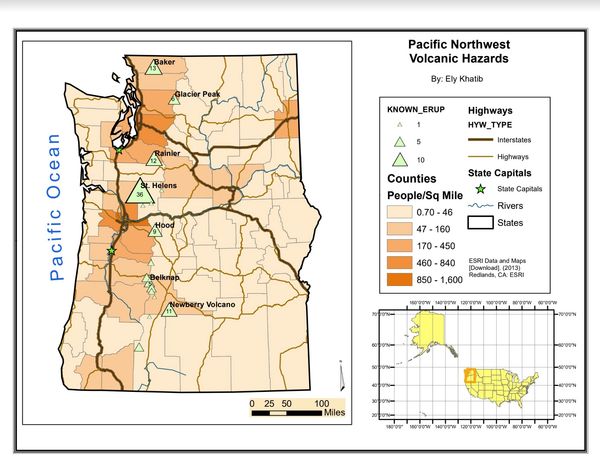
Volcanic Hazards
In the image to the left, one can see the array and size of volcanoes along Oregon and Washington States. Embedded within the map is the population of people per square mile, and other significant features.

Flood Risk Using Remote Data Services
To the right is a map displaying the various land uses of San Joaquin County, CA. On top of the land is a transparent water layer illustrating flood risk. The specialty of this map is that all of the data is linked from a remote data service. Besides the basemap, there is no information on here that is a shapefile or polygon.